Reports
Supabase Reports provide comprehensive observability for your project through dedicated monitoring dashboards for servers:
- Database
- Auth
- Storage
- Realtime
- API systems
Each report offers self-debugging tools to gain actionable insights for optimizing performance and troubleshooting issues.
Reports are only available for projects hosted on the Supabase Cloud platform and are not available for self-hosted instances.
Using reports#
You can filter reports by time range to focus on a specific period. Higher-tier plans provide access to longer time ranges.
| Time Range | Free | Pro | Team | Enterprise |
|---|---|---|---|---|
| Last 10 minutes | ✅ | ✅ | ✅ | ✅ |
| Last 30 minutes | ✅ | ✅ | ✅ | ✅ |
| Last 60 minutes | ✅ | ✅ | ✅ | ✅ |
| Last 3 hours | ✅ | ✅ | ✅ | ✅ |
| Last 24 hours | ✅ | ✅ | ✅ | ✅ |
| Last 7 days | ❌ | ✅ | ✅ | ✅ |
| Last 14 days | ❌ | ❌ | ✅ | ✅ |
| Last 28 days | ❌ | ❌ | ✅ | ✅ |
API gateway#
The API Gateway report analyzes performance and traffic patterns managed by your project's API layer.
| Chart | Description | Key Insights |
|---|---|---|
| Total Requests | Overall API request volume | Traffic patterns and growth trends, including top routes |
| Response Errors | Error rates with 4XX and 5XX status codes | API reliability and user experience issues, including top routes |
| Response Speed | Average API response times | Performance bottlenecks and optimization targets, including top routes |
| Network Traffic | Request and response egress usage | Data transfer patterns and cost implications |
Auth#
The Auth reports focus on user authentication patterns and behaviors within your Supabase project.
| Chart | Description | Key Insights |
|---|---|---|
| Active Users | Count of unique users performing auth actions | User engagement and retention patterns |
| Sign In Attempts by Type | Breakdown of authentication methods used | Password vs OAuth vs magic link preferences |
| Sign Ups | Total new user registrations | Growth trends and onboarding funnel performance |
| API Gateway Auth Errors | Error rates grouped by status code | Authentication friction and security issues |
| Password Reset Requests | Volume of password recovery attempts | User experience pain points |
Auth API Gateway#
The Auth API Gateway reports focus on API requests related to authentication and user management.
| Chart | Description | Key Insights |
|---|---|---|
| Total Requests | Count of unique users performing auth actions | User engagement and retention patterns, including top routes |
| Response Errors | Error rates with 4XX and 5XX status codes | API reliability and user experience issues, including top routes |
| Response speed | Average response time for auth requests | Performance bottlenecks and optimization opportunities, including top routes |
| Network Traffic | Ingress and egress usage | Data transfer costs and CDN effectiveness |
Database#
The Database report provides a comprehensive view into your Postgres instance's health and performance characteristics. These charts help you identify performance bottlenecks and resource constraints at a glance.
The following charts are available for Free and Pro plans:
| Chart | Available Plans | Description | Key Insights |
|---|---|---|---|
| Memory usage | Free, Pro | RAM usage percentage by the database | Memory pressure and resource utilization |
| CPU usage | Free, Pro | Average CPU usage percentage | CPU-intensive query identification |
| Disk IOPS | Free, Pro | Read/write operations per second with limits | IO bottleneck detection and workload analysis |
| Database connections | Free, Pro | Number of pooler connections to the database | Connection pool monitoring |
| Dedicated Pooler connections | All | Client connections to PgBouncer | Dedicated pooler connection monitoring |
| Shared Pooler connections | All | Client connections to the shared pooler | Shared pooler usage patterns |
| Shared Pooler connections | All | Client connections to the shared pooler | Shared pooler usage patterns |
| Disk usage | Free, Pro | Disk space consumption breakdown | Storage capacity planning |
| Database size | Free, Pro | Total database size and growth trends | Space consumption monitoring, including list of largest tables |
Advanced Telemetry#
The following charts provide a more advanced and detailed view of your database performance and are available only for Team, Enterprise, and Platform plans.
Memory usage#

| Component | Description |
|---|---|
| Used | RAM actively used by Postgres and the operating system |
| Cache + buffers | Memory used for page cache and OS buffers |
| Free | Available unallocated memory |
| Swap | Disk overflow used when physical RAM is exhausted |
The Swap series only appears when the system is swapping. Swap is disk space the operating system uses as an overflow when physical RAM is full. Because disk is much slower than RAM, sustained swap activity indicates memory pressure and can significantly degrade database performance.
How it helps debug issues:
| Issue | Description |
|---|---|
| Memory pressure detection | Identify when free memory is consistently low |
| Cache effectiveness monitoring | Monitor cache performance for query optimization |
| Memory leak detection | Detect inefficient memory usage patterns |
| Swap activity monitoring | Sustained swap usage signals RAM is exhausted and paging to disk is degrading performance |
Actions you can take:
| Action | Description |
|---|---|
| Upgrade compute size | Increase available memory resources |
| Optimize queries | Reduce memory consumption of expensive queries |
| Tune Postgres configuration | Improve memory management settings |
| Implement application caching | Add query result caching to reduce memory load |
Memory commitment#
The Memory commitment chart shows how much memory the Linux kernel has promised to processes (Committed_AS) against the maximum it is willing to promise (CommitLimit). It is a leading indicator of out-of-memory risk that is not visible on the Memory usage chart.
Memory is committed when a process asks the kernel for an allocation (for example via malloc, a stack growth, or mmap). The kernel records the promise immediately, but only assigns physical pages when a page is first written. Committed memory is therefore the sum of every outstanding promise across every process, regardless of whether those pages have been touched yet.
| Component | Description |
|---|---|
| Committed | Total memory the kernel has promised to processes (Committed_AS). Includes promises that have not yet been backed by physical pages. |
| Commit limit | Maximum memory the kernel will commit (CommitLimit). Derived from physical RAM, swap, and the kernel's overcommit ratio. Acts as the danger threshold for this chart. |
How to read it:
| Pattern | What it means |
|---|---|
| Flat Committed well below the Commit limit | Healthy. Connections and queries are sized for the compute tier. |
| Committed gradually rising over days or weeks | Organic growth or a memory leak. Investigate connection counts, long-lived prepared statements, and extensions before usage outgrows the tier. |
| Committed spiking near or above the Commit limit | Dangerous. Usually a connection storm or several large concurrent queries. The next spike may trigger the OOM killer and crash Postgres. |
| Committed sustained above the Commit limit | The instance is on borrowed time. Plan an upgrade or fix the workload before the next out-of-memory event. |
Why this matters for Postgres:
- Each new connection is a
fork()of the postmaster, which inflates Committed_AS by roughly the size ofshared_buffersuntil copy-on-write pages diverge. Connection bursts can therefore blow past the Commit limit long before physical memory is exhausted. - Each query can allocate up to
work_memper sort or hash node. A handful of expensive concurrent queries can push commit far above what the Memory usage chart reports as "used". - When the kernel cannot honor its promises, the OOM killer terminates a process. On a database server that is usually a Postgres backend or, worse, the postmaster, which takes the whole database down.
Actions you can take:
| Action | Description |
|---|---|
| Use connection pooling | Route clients through Supavisor or PgBouncer to cap fork-driven commit pressure. |
Lower max_connections or per-pool sizes | Reduce the upper bound on concurrent backends so spikes cannot exceed the Commit limit. |
Tune work_mem | Reduce per-operation memory allocations on workloads with many concurrent queries. |
| Upgrade compute size | Raise both physical RAM and the Commit limit so the workload fits with headroom. |
CPU usage#

| Category | Description |
|---|---|
| System | CPU time for kernel operations |
| User | CPU time for database queries and user processes |
| IOWait | CPU time waiting for disk/network IO |
| IRQs | CPU time handling interrupts |
| Other | CPU time for miscellaneous tasks |
How it helps debug issues:
| Issue | Description |
|---|---|
| CPU-intensive query identification | Identify expensive queries when User CPU is high |
| IO bottleneck detection | Detect disk/network issues when IOWait is elevated |
| System overhead monitoring | Monitor resource contention and kernel overhead |
Actions you can take:
| Action | Description |
|---|---|
| Optimize CPU-intensive queries | Target queries causing high User CPU usage |
| Address IO bottlenecks | Resolve disk/network issues when IOWait is high |
| Upgrade compute size | Increase available CPU capacity |
| Implement proper indexing | Use query optimization techniques |
Disk input/output operations per second (IOPS)#

This chart displays read and write IOPS with a reference line showing your compute size's maximum IOPS capacity.
How it helps debug issues:
| Issue | Description |
|---|---|
| Disk IO bottleneck identification | Identify when disk IO becomes a performance constraint |
| Workload pattern analysis | Distinguish between read-heavy vs write-heavy operations |
| Performance correlation | Spot disk activity spikes that correlate with performance issues |
Actions you can take:
| Action | Description |
|---|---|
| Optimize indexing | Reduce high read IOPS through better query indexing |
| Consider read replicas | Distribute read-heavy workloads across multiple instances |
| Batch write operations | Reduce write IOPS by grouping database writes |
| Upgrade compute size | Increase IOPS limits with larger compute instances |
Disk throughput#
Available on Team and Enterprise plans.
This chart displays read and write throughput (bytes per second) with a reference line showing your compute size's maximum disk throughput.
How it helps debug issues:
| Issue | Description |
|---|---|
| Throughput bottleneck identification | Spot when disk bandwidth is saturated |
| Workload pattern analysis | Differentiate read-heavy vs write-heavy bandwidth usage |
| Performance correlation | Correlate spikes with query performance changes |
Actions you can take:
| Action | Description |
|---|---|
| Optimize disk-intensive queries | Reduce queries that perform excessive reads/writes |
| Tune caching and batching | Minimize repeated disk access and improve throughput headroom |
| Upgrade compute size | Increase throughput limits for sustained workloads |
| Review database design | Optimize schema and query patterns for efficiency |
| Add strategic indexes | Reduce sequential scans with appropriate indexing |
Disk size#

| Component | Description |
|---|---|
| Database | Space used by your actual database data (tables, indexes) |
| WAL | Space used by Write-Ahead Logging |
| System | Reserved space for system operations |
How it helps debug issues:
| Issue | Description |
|---|---|
| Space consumption monitoring | Track disk usage trends over time |
| Growth pattern identification | Identify rapid growth requiring attention |
| Capacity planning | Plan upgrades before hitting storage limits |
Actions you can take:
| Action | Description |
|---|---|
| Run VACUUM operations | Reclaim dead tuple space and optimize storage |
| Analyze large tables | Use CLI commands like table-sizes to identify optimization targets |
| Implement data archival | Archive historical data to reduce active storage needs |
| Upgrade disk size | Increase storage capacity when approaching limits |
Query Performance#
Links to the Query Performance Advisory page in the dashboard, which provides a detailed analysis of slow database queries
Database connections#
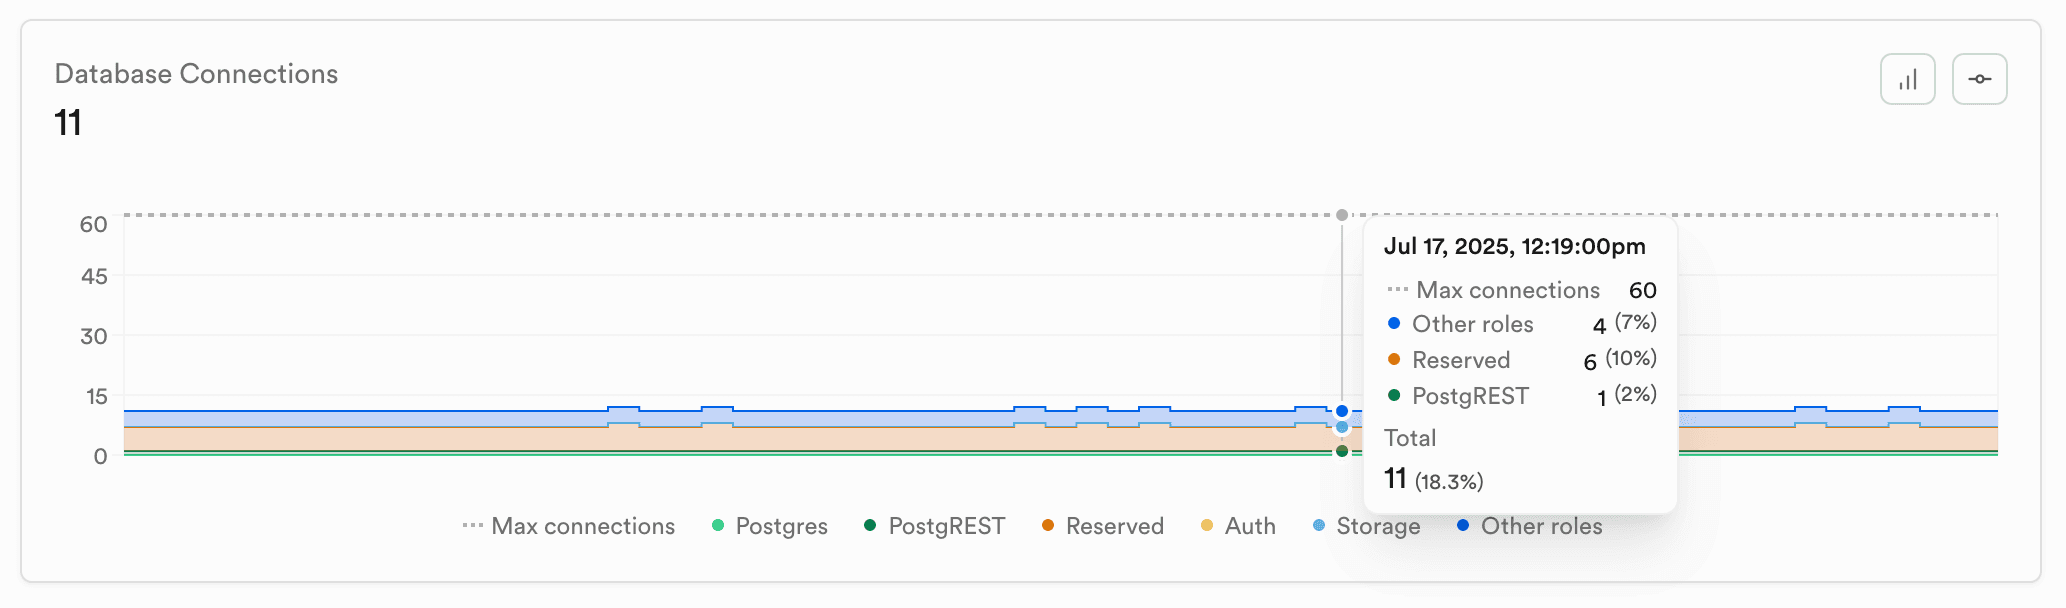
| Connection Type | Description |
|---|---|
| Postgres | Direct connections from your application |
| PostgREST | Connections from the PostgREST API layer |
| Reserved | Administrative connections for Supabase services |
| Auth | Connections from Supabase Auth service |
| Storage | Connections from Supabase Storage service |
| Other roles | Miscellaneous database connections |
How it helps debug issues:
| Issue | Description |
|---|---|
| Connection pool exhaustion | Identify when approaching maximum connection limits |
| Connection leak detection | Spot applications not properly closing connections |
| Service distribution monitoring | Monitor connection usage across different Supabase services |
Actions you can take:
| Action | Description |
|---|---|
| Upgrade compute size | Increase maximum connection limits |
| Implement connection pooling | Optimize connection management for high direct connection usage |
| Review application code | Ensure proper connection handling and cleanup |
Dedicated Pooler (PgBouncer) Client Connections#
Available on Team and Enterprise plans.
This chart displays the number of PgBouncer connections over time.
How it helps debug issues:
| Issue | Description |
|---|---|
| Connection pool exhaustion | Identify when approaching maximum connection limits |
| Connection leak detection | Spot applications not properly closing connections |
| Service distribution monitoring | Monitor connection usage across different Supabase services |
Actions you can take:
| Action | Description |
|---|---|
| Upgrade compute size | Increase maximum connection limits |
| Implement connection pooling | Optimize connection management for high direct connection usage |
| Review application code | Ensure proper connection handling and cleanup |
Shared Pooler (Supavisor) Client Connections#
Available on Team and Enterprise plans.
This chart displays the number of Supavisor connections over time.
How it helps debug issues:
| Issue | Description |
|---|---|
| Connection pool exhaustion | Identify when approaching maximum connection limits |
| Connection leak detection | Spot applications not properly closing connections |
| Service distribution monitoring | Monitor connection usage across different Supabase services |
Actions you can take:
| Action | Description |
|---|---|
| Upgrade compute size | Increase maximum connection limits |
| Implement connection pooling | Optimize connection management for high direct connection usage |
| Review application code | Ensure proper connection handling and cleanup |
Disk Usage#
Database size#
| Component | Description |
|---|---|
| Database | Space used by your actual database data (tables, indexes) |
| WAL | Space used by Write-Ahead Logging |
| System | Reserved space for system operations |
How it helps debug issues:
| Issue | Description |
|---|---|
| Space consumption monitoring | Track disk usage trends over time |
| Growth pattern identification | Identify rapid growth requiring attention |
| Capacity planning | Plan upgrades before hitting storage limits |
Actions you can take:
| Action | Description |
|---|---|
| Run VACUUM operations | Reclaim dead tuple space and optimize storage |
| Analyze large tables | Use CLI commands like table-sizes to identify optimization targets |
| Implement data archival | Archive historical data to reduce active storage needs |
| Upgrade disk size | Increase storage capacity when approaching limits |
Edge Functions#
The Edge Functions report provides insights into serverless function performance, execution patterns, and regional distribution across Supabase's global edge network.
| Chart | Description | Key Insights |
|---|---|---|
| Total Edge Function Invocations | Function response codes and error rates | Function reliability and error patterns |
| Edge Function Execution Status Codes | Function response codes and error rates | Function reliability and error patterns |
| Edge Function Execution Time | Average function duration and performance | Performance optimization opportunities |
| Edge Function Invocations by Region | Geographic distribution of function calls | Global usage patterns and latency optimization |
PostgREST#
The PostgREST report provides insights into RESTful API performance, request patterns, and response characteristics.
| Chart | Description | Key Insights |
|---|---|---|
| Total Requests | HTTP requests to PostgREST endpoints | API usage alongside WebSocket activity |
| Response Errors | Error rates with 4XX and 5XX status codes | API reliability and user experience issues, including top routes |
| Response Speed | Average response time for PostgREST requests | Performance bottlenecks and optimization opportunities, including top routes |
| Network Traffic | Ingress and egress usage | Data transfer costs and CDN effectiveness |
Realtime#
The Realtime report tracks WebSocket connections, channel activity, and real-time event patterns in your Supabase project.
| Chart | Description | Key Insights |
|---|---|---|
| Connected Clients | Active WebSocket connections over time | Concurrent user activity and connection stability |
| Broadcast Events | Broadcast events over time | Real-time feature usage patterns |
| Presence Events | Presence events over time | Real-time feature usage patterns |
| Postgres Changes Events | Postgres Changes events over time | Real-time feature usage patterns |
| Rate of Channel Joins | Frequency of new channel subscriptions | User engagement with real-time features |
| Message Payload Size | Median size of message payloads sent | Payload size that is being transmitted |
| Broadcast From Database Replication Lag | Median latency between database commit and broadcast when using broadcast from database | Latency to Broadcast from the database |
| Read/Write Private Channel Subscription RLS Execution Time | Median time to authorize private channels | realtime.messages RLS policies performance |
| Total Requests | HTTP requests to Realtime endpoints | API usage alongside WebSocket activity |
| Response Speed | Performance of Realtime API endpoints | Infrastructure optimization opportunities |
Realtime API Gateway#
The Realtime API Gateway reports focus on API requests related to Realtime functionality.
| Chart | Description | Key Insights |
|---|---|---|
| Total Requests | HTTP requests to Realtime endpoints | API usage alongside WebSocket activity, including top routes |
| Response Errors | HTTP requests to Realtime endpoints | API usage alongside WebSocket activity, including top routes |
| Response Speed | Performance of Realtime API endpoints | Infrastructure optimization opportunities, including top routes |
Storage#
The Storage report provides visibility into how your Supabase Storage is being used, including request patterns, performance characteristics, and caching effectiveness.
| Chart | Description | Key Insights |
|---|---|---|
| Total Requests | Overall request volume to Storage | Traffic patterns and usage trends, including top routes |
| Response Speed | Average response time for storage requests | Performance bottlenecks and optimization opportunities, including top routes |
| Network Traffic | Ingress and egress usage | Data transfer costs and CDN effectiveness |
| Request Caching | Cache hit rates and miss patterns | CDN performance and cost optimization, including top routes |